
Mastering Kubernetes Health Checks: Deploy Application With Probe Endpoints - Part 2 out of 3
In Part 1, we explored the theoretical foundations of Kubernetes probes. Now, we'll deploy and configure the Valkyrie application - a purpose-built tool that demonstrates probe behavior through hands-on experimentation.
Valkyrie simulates real-world scenarios with:
- Long startup processes using CPU-intensive calculations
- Interactive failure simulation via web interface
- Real-time probe status monitoring
By the end of this guide, you'll have Valkyrie running in your cluster, ready for the advanced probe configurations we'll explore in Part 3.
What is Valkyrie?
Valkyrie is a Go-based web application designed to demonstrate Kubernetes probe behavior in a controlled environment. It provides visible feedback on probe interactions, allowing you to trigger failures and observe how Kubernetes responds.
Key Application Components
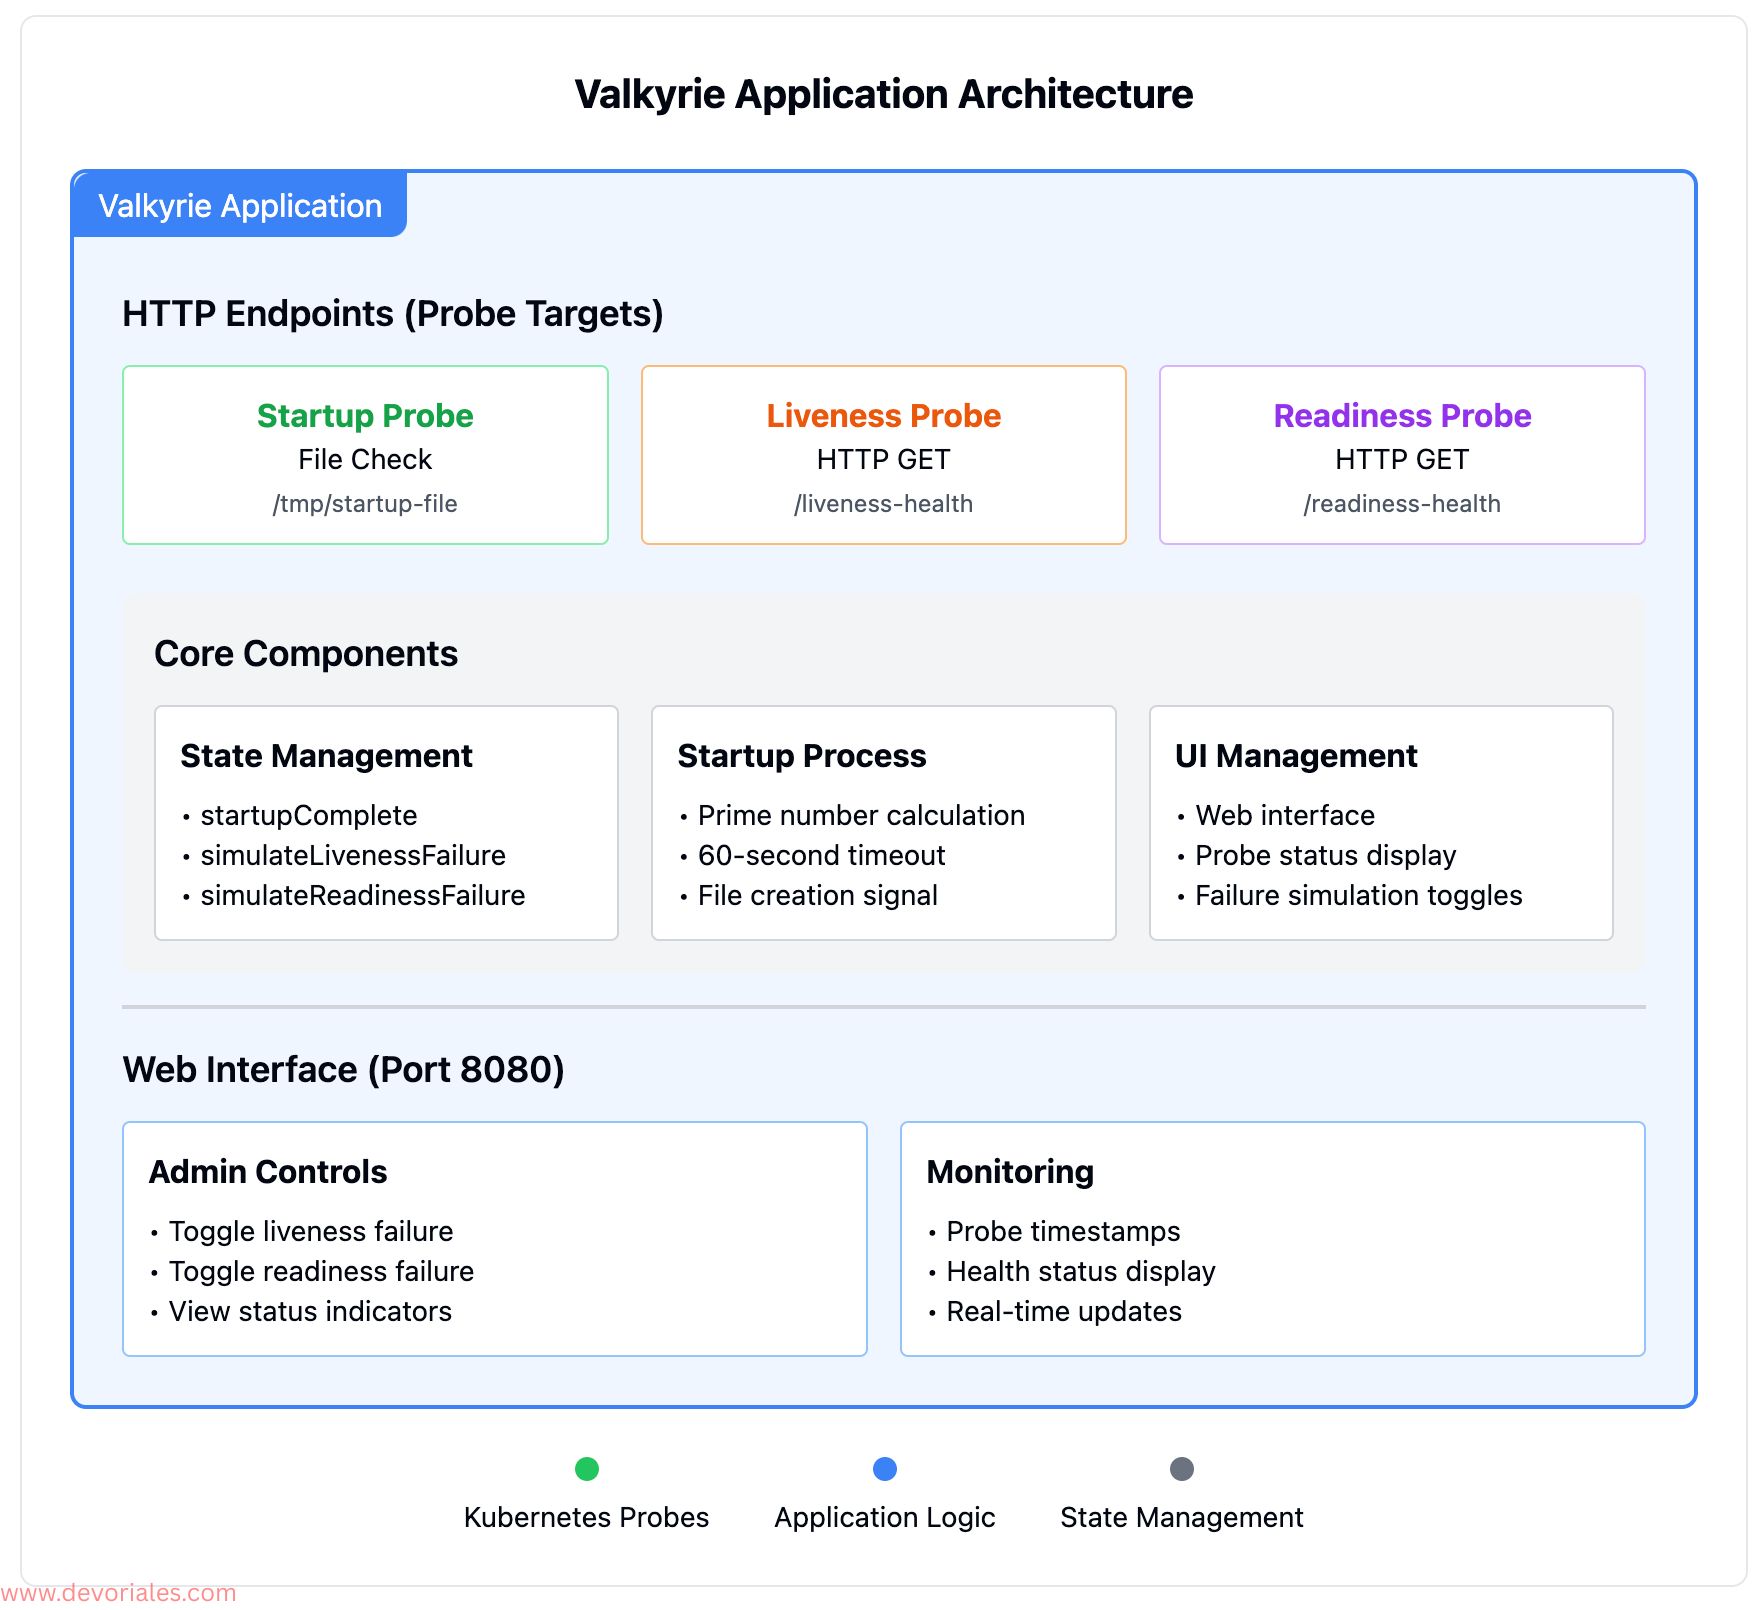
Startup Simulation The app calculates prime numbers during startup, simulating real-world initialization tasks like loading configurations or establishing database connections. Once complete, it creates /tmp/startup-file as a startup indicator.
Health Endpoints
/liveness-health- Returns HTTP 200 when healthy, 500/503 when unhealthy/readiness-health- Returns HTTP 200 when ready, 503 when not ready- Web UI at
/- Interactive controls for triggering probe failures
State Management Uses atomic variables to safely manage probe states across concurrent requests:
simulateLivenessFailure- Toggle liveness probe failuressimulateReadinessFailure- Toggle readiness probe failuresstartupComplete- Track startup completion status
Building and Containerizing Valkyrie
The code and the Kubernetes manifests can be downloaded from the following GitHub Repository:
https://github.com/devoriales/app-health-probes
Step 1: Prepare the Application
First, ensure you have the application files:
main.go- The Valkyrie application codeDockerfile- Multi-stage build configuration
Initialize the Go module:
RUN go mod tidy
go build -o main .
Step 2: Test Locally (Optional)
Verify the application works before containerizing:
export PRIME_NUMBER_COUNT=1000
go run main.go

# In another terminal, test the endpoints
curl http://localhost:8080/liveness-health
curl http://localhost:8080/readiness-health
Step 3: Build and Push Docker Image
The Dockerfile uses multi-stage builds for efficiency:
Choose the appropriate build method for your environment:
Option A: Local Development with k3d
# Build image
docker build -t valkyrie-app:1.0 .

# Tag for k3d registry
docker tag valkyrie-app:1.0 registry.localhost:5000/valkyrie-app:1.0

# Push to k3d registry
docker push registry.localhost:5000/valkyrie-app:1.0
Option B: Remote Registry
# Build and push
docker build -t your-registry/valkyrie-app:1.0 .
docker push your-registry/valkyrie-app:1.0
Option C: Multi-architecture (for Apple Silicon)
docker buildx create --name multiplatform-builder --use
docker buildx build \
  --platform linux/amd64,linux/arm64 \
  -t your-registry/valkyrie-app:1.0 \
  --push .
Understanding the Probe Configuration
Let's analyze Valkyrie's probe configurations and why they're structured this way:
Probe Configuration Comparison
| Aspect | Startup | Liveness | Readiness |
|---|---|---|---|
| Check Method | Exec (file check) | HTTP GET | HTTP GET |
| Initial Delay | 10s | 10s | 5s |
| Period | 10s | 5s | 10s |
| Timeout | 10s | 2s | 2s |
| Failure Threshold | 7 | 3 | 3 |
| Max Time to Fail | 80s | 15s | 30s |
Configuration Rationale
Startup Probe
- Uses exec command to check for
/tmp/startup-file - Allows up to 80 seconds for application startup (10s initial + 7 failures × 10s)
- Prevents liveness/readiness probes from interfering during initialization
Liveness Probe
- Checks
/liveness-healthendpoint every 5 seconds - Quick failure detection: restarts after 15 seconds of failures
- Short timeout (2s) to catch hanging requests
Readiness Probe
- Checks
/readiness-healthendpoint every 10 seconds - More lenient than liveness to prevent traffic disruption
- Removes pod from service endpoints when not ready
Deploying to Kubernetes
Create valkyrie-manifests.yaml with the complete configuration:
---
apiVersion: v1
kind: Namespace
metadata:
  name: valkyrie
---
apiVersion: apps/v1
kind: Deployment
metadata:
  name: critical-app
  namespace: valkyrie
spec:
  replicas: 1
  selector:
    matchLabels:
      app: critical-app
  template:
    metadata:
      labels:
        app: critical-app
    spec:
      containers:
      - name: critical-app
        image: your-registry/valkyrie-app:1.0  # Update with your registry
        ports:
        - containerPort: 8080
        env:
        - name: PRIME_NUMBER_COUNT
          value: "1000"

        # Startup Probe - Checks if startup is complete
        startupProbe:
          exec:
            command:
            - sh
            - -c
            - "test -f /tmp/startup-file"
          initialDelaySeconds: 10
          periodSeconds: 10
          timeoutSeconds: 10
          failureThreshold: 7
          successThreshold: 1

        # Liveness Probe - Restarts container if unhealthy
        livenessProbe:
          httpGet:
            path: /liveness-health
            port: 8080
          initialDelaySeconds: 10
          periodSeconds: 5
          timeoutSeconds: 2
          failureThreshold: 3
          successThreshold: 1

        # Readiness Probe - Controls traffic routing
        readinessProbe:
          httpGet:
            path: /readiness-health
            port: 8080
          initialDelaySeconds: 5
          periodSeconds: 10
          timeoutSeconds: 2
          failureThreshold: 3
          successThreshold: 1
---
apiVersion: v1
kind: Service
metadata:
  name: critical-app-clusterip
  namespace: valkyrie
spec:
  selector:
    app: critical-app
  ports:
  - protocol: TCP
    port: 80
    targetPort: 8080
Deploy the application:
# Apply the manifests
kubectl apply -f valkyrie-manifests.yaml

# Verify deployment
kubectl get pods -n valkyrie -w

# Check probe status
kubectl describe pod -n valkyrie -l app=critical-app

# Access the application
kubectl port-forward -n valkyrie svc/critical-app-clusterip 8080:80
Accessing the Web Interface
Once the port-forward is running, open your browser to http://localhost:8080
The Valkyrie interface provides:
- Real-time Status Indicators - Visual feedback for liveness and readiness states
- Failure Simulation Toggles - Checkboxes to trigger probe failures
- Timestamp Tracking - Shows when each probe was first executed
Quick Troubleshooting
Pod not starting?
# Check logs
kubectl logs -n valkyrie -l app=critical-app

# Check events
kubectl describe pod -n valkyrie -l app=critical-app
Image pull errors?
- Verify your registry URL in the deployment manifest
- Ensure you've pushed the image to the correct registry
- Check image pull secrets if using a private registry
Can't access the web UI?
- Ensure the port-forward command is still running
- Try a different local port if 8080 is in use:
kubectl port-forward -n valkyrie svc/critical-app-clusterip 8888:80
Understanding the Probe Timeline
During startup, the probes activate in sequence:
- 0-10s: Container initializing, no probes active
- 10s: Startup probe begins checking for
/tmp/startup-file - ~60s: Startup completes (depending on PRIME_NUMBER_COUNT)
- After startup: Liveness and readiness probes begin running concurrently
- Ongoing: Probes continue at their configured intervals
What You've Accomplished
✅ Built and deployed the Valkyrie application
✅ Configured all three probe types with appropriate settings
✅ Established access to the web interface for testing
✅ Understood the probe configuration rationale
Ready for Part 3
With Valkyrie running in your cluster, you're now prepared to:
- Simulate various failure scenarios and observe Kubernetes responses
- Fine-tune probe configurations for different use cases
- Learn production troubleshooting techniques
- Explore advanced probe patterns and best practices
In Part 3, we'll use the interactive features of Valkyrie to demonstrate how Kubernetes responds to different probe failures, helping you build intuition for configuring probes in your own applications.